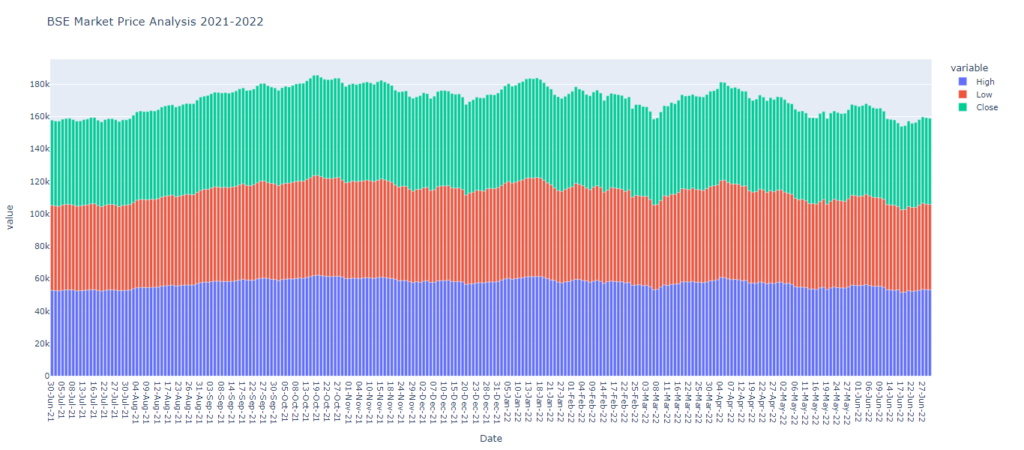
Live Stock ticker using Python
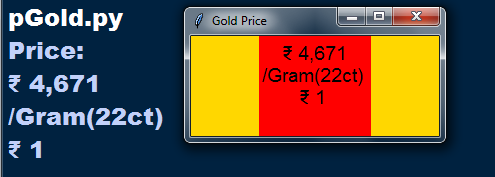
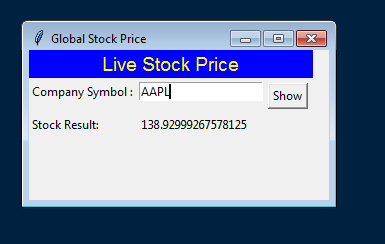
In this example we will be knowing that how to show live stock price using Python with various python packages. Lets have an example from yahoo_fin import stock_info from tkinter import * def stock_price(): price = stock_info.get_live_price(e1.get()) Current_stock.set(price) master = Tk() master.geometry(‘300×150’) master.title(‘Global Stock Price’) Current_stock = StringVar() Label(master, text=”Live Stock Price”, font=’sans 14′, fg=’yellow’, […]

Live Stock ticker using Python Read More »